If you’re paying attention to media reports on crime in this election year, you’re going to hear that violent crime is at a 50-year low. It is a talking point being repeated constantly by the mainstream media, the Biden Administration and of course those who want you to believe it- Democrats and their media allies who understand their views on crime are unpopular with the public and want to confuse voters in an election year. While this new 50-year low point on crime may be surprising to Americans who must live with crime as a daily part of their lives, it is not if you have been paying close attention on how crime is now calculated, especially in a post Black Lives Matter America.
Crime statistics often serve as a measurement for assessing the safety and security of a community. We use crime statistics to tell us how safe and unsafe our communities are, where we want to live or moved from, law enforcement budgets and so forth. However, behind these objective figures lies a web of factors that are obvious to see but can distort the true picture of crime in your community. One of the most insidious tactics employed is the logical fallacy of exclusion, wherein certain crimes are conveniently omitted from official records, painting a rosier, yet misleading, portrait of public safety. And while some of it is true, like homicides being down, other crime reports don’t help educate the public on crime spreading in America. And in an election year, you can bet progressives and the media will be using these statistics to mislead voters on what is really happening with crime in America urban centers.
This deception of crime statistics operates by selectively categorizing certain activities as non-criminal, thereby changing its definition by simply ignoring by implementing various weak-on-crime policies that prohibit enforcement and/or by simply not counting it- all leading to artificially deflating crime rates.
For instance, for traffic violations, jurisdictions like San Francisco have policies that overlook certain offenses, such as reckless driving and underreporting incidents, to create the illusion of safer streets. An example of such policies is the racial justice policy implemented by San Francisco in 2015, which deters and scares law enforcement from enforcing traffic offenses because the statistics may show minorities are more likely to be stopped for traffic violations. Notably, from the graph below a sudden reduction in traffic citations post 2015.
The ramifications of this selective reporting extend beyond mere statistical discrepancies; they have real world consequences for public safety and confuses the public. And the media are of little help in drawing this issue to the attention of voters, perhaps on purpose. Instead of focusing exclusively on statistics, the public should ask themselves, can I keep my older model Kia and Hyundai in my driveway without fear of someone picking at it? Is it safe to drive on city streets in America’s urban centers? Those are truer barometers of crime than misleading statistics we are fed. In January of this year, Gallup polled Americans on this very issue, and over two-thirds were convinced that crime is on the rise. How crime is reported to the FBI can be cause for confusion itself.
And back to San Francisco- traffic deaths increased year over year post 2020. One thing you can’t hide are actual deaths, at least not, yet.


Isn’t that what happened just before? Trump won the first time they left him in chaos and pillaging.
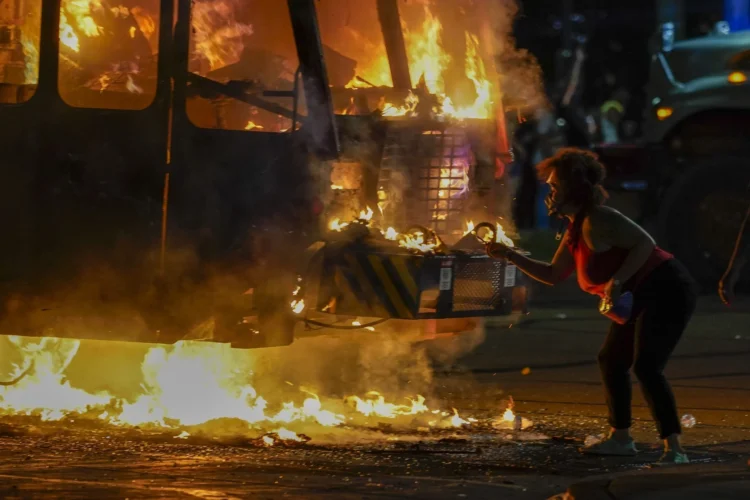
Fires, property destruction.
Someone had to. Organize These protests. They were told to go there. I could go on and on but I won’t do any good.
They’re threatened by Trump..